
Start here: Setup and data representations of mathematical objects
A no-frills introduction to introducing computation into your research. No background knowledge assumed.
This is the first tutorial in a series on machine learning for mathematics (ML4Math for short). No background knowledge of coding or ML will be assumed. The goal of this tutorial is to set you up for the other tutorials in this series with the necessary background knowledge, environment, and confidence. If you are already familiar with concepts like coding in Python, executing terminal commands, and generating mathematical data, you may proceed to the tutorial on Logistic regression and linear probes coming soon. Otherwise, let's get started!
The shape of a ML problem
A typical ML problem looks like this:
- An outcome/label (the quantity you are interested in studying)
- Inputs (quantities that you suspect predict )
- A model (this is the unknown function that relates and using the unknown collection of parameters ).
In a perfect world, is handed to us and serves as the basis for a mathematical result.
The Pythagorean Theorem is a perfect example of this. Let's assume that you want to know which triples of nonnegative integers , are Pythagorean triples and which ones are not. Let's label all such triples with if the triple appears as the side lengths of a right triangle, and otherwise. Then the Pythagorean Theorem tells us where is the indicator function.
(Un)fortunately for us, the whole process of math research is discovering , not having it handed to us. But before we can go off proving landmark results with the help of ML, we need to figure out how exactly to get our hands on the mathematical data needed to train a model and how it should be represented.
Representing mathematical objects
Here are some common representations of mathematical data that can be fed into a computer program:
- Fixed-length vectors
- This is the most common representation of mathematical data since it is the most versatile.
- Useful when you have a list of invarants that you think are sufficient to predict .
- If you want to use a matrix as input instead of a vector, consider flattening the matrix! For example,
- Sequences and words
- Sometimes your input is not a standardized length. Common examples of this are words on a finite alphabet subject to a constraint, or the plain-language sentences we feed into LLMs.
- This can sometimes be transformed into fixed-length vectors by padding shorter sequences to be as-long-as the longest sequence in the dataset. However, this can have unintended drawbacks.
- Graphs
- Believe it or not, computers are particularly friendly to graphs (a finite set of nodes and edges).
- There are even entire Python libraries for working with graphs (for example, NetworkX).
- Grids and discretized functions (PDE solutions, spatial data)
- This is for data that is shaped like a picture. Think about visualizing a solution to the heat equation on a unit square, discretized to a pixelated picture.
- This is also the preferred data type for tensors.
First steps
We are going to start by accessing a free, no-fuss Python environment called Google Colab. When you navigate to the site for the first time, you might have to log in with a Google account. After that, you should see a screen that looks a lot like this:
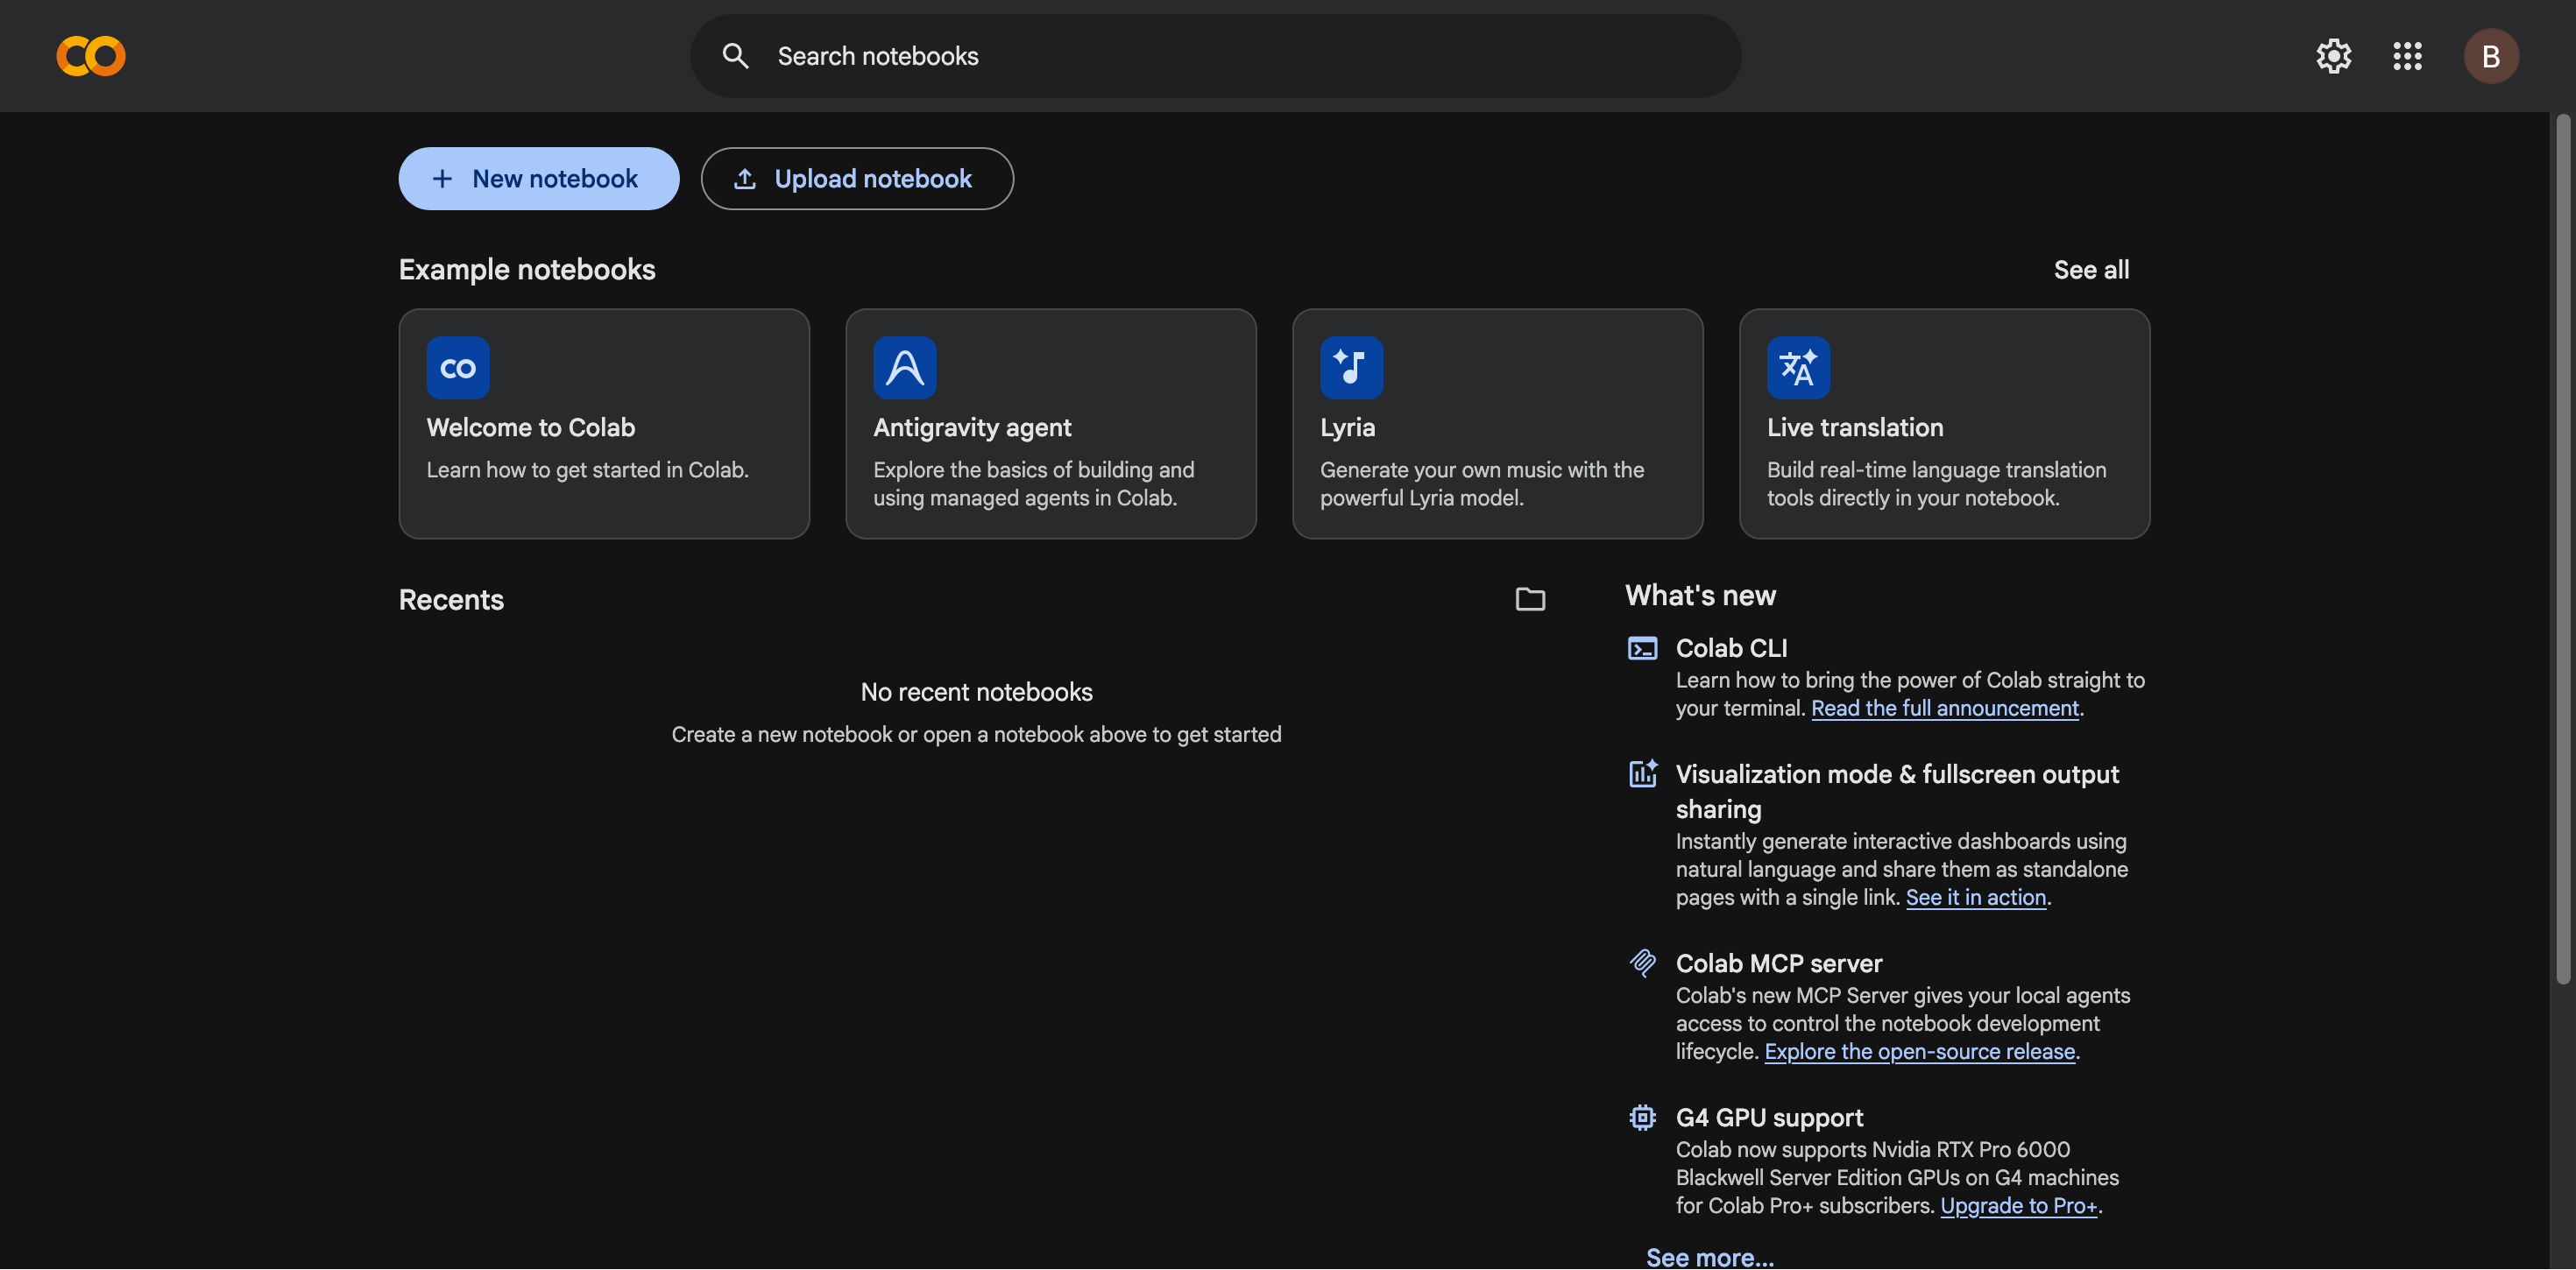
After clicking "+ New notebook", you will be directed to a page containing a blank that looks like this:
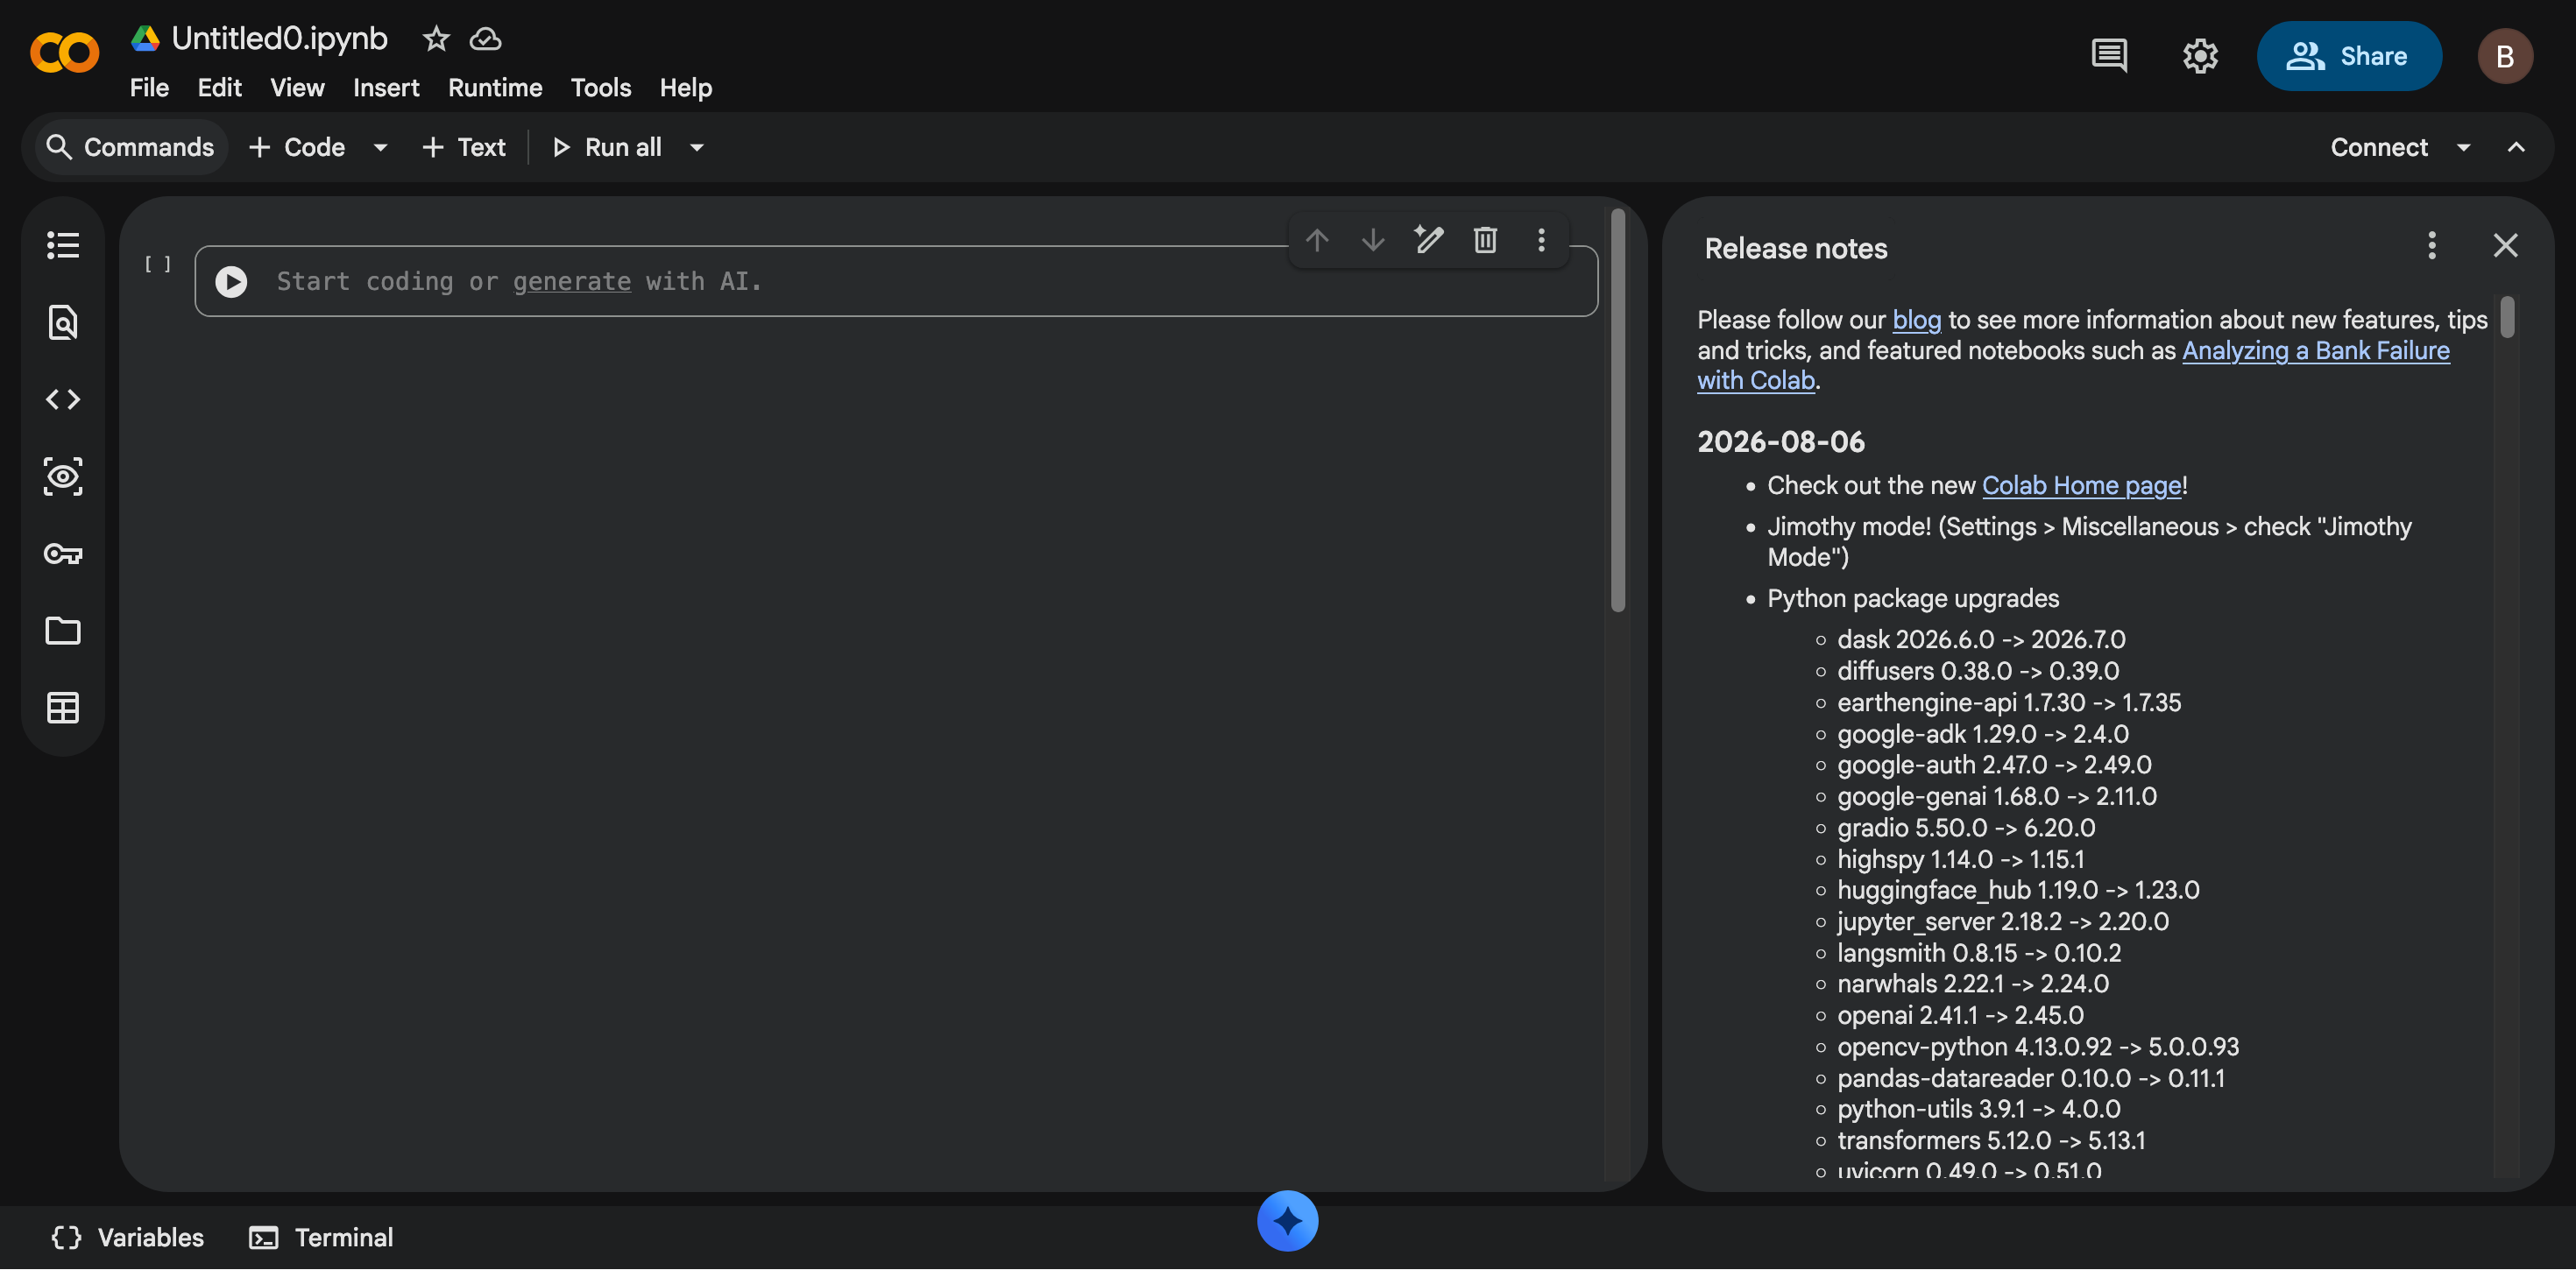
Go ahead and give your new notebook a name! I called mine "ML_Tutorial_Series.ipynb". The next section of this tutorial will get into generating and importing datasets that will be used in the rest of the tutorials in this series. If you'd like more information about the specifics of Jupyter notebooks, particularly through the Google Colab interface, you can find some very nice information here.
Getting your hands on datasets
Downloading data: LMFDB number field dataset
The simplest way to start working with mathematical data is to download data that has already been created and/or curated for use by mathematicians and computers. MathBases.org contains a list of nearly 200 mathematical databases, including the LMFDB, The House of Graphs, KnotInfo, and many more! Let's pull some data from the LMFDB that we can use going forward.
Suppose I'm interested in differentiating the Galois groups of degree 8 number fields that are ramified at exactly 3 primes. The two Galois groups I care about differentiating are the quaternion group Q8 and the dihedral group D4. I have a hypothesis that there is some invariant out there that will help me distinguish these two Galois groups over this dataset. How would I go about getting data to possibly answer this question?
Navigate to the LMFDB's number field search page. Once you are there, let's search for Degree = 8, Ramified prime count = 3, and Galois group = D4,Q8:
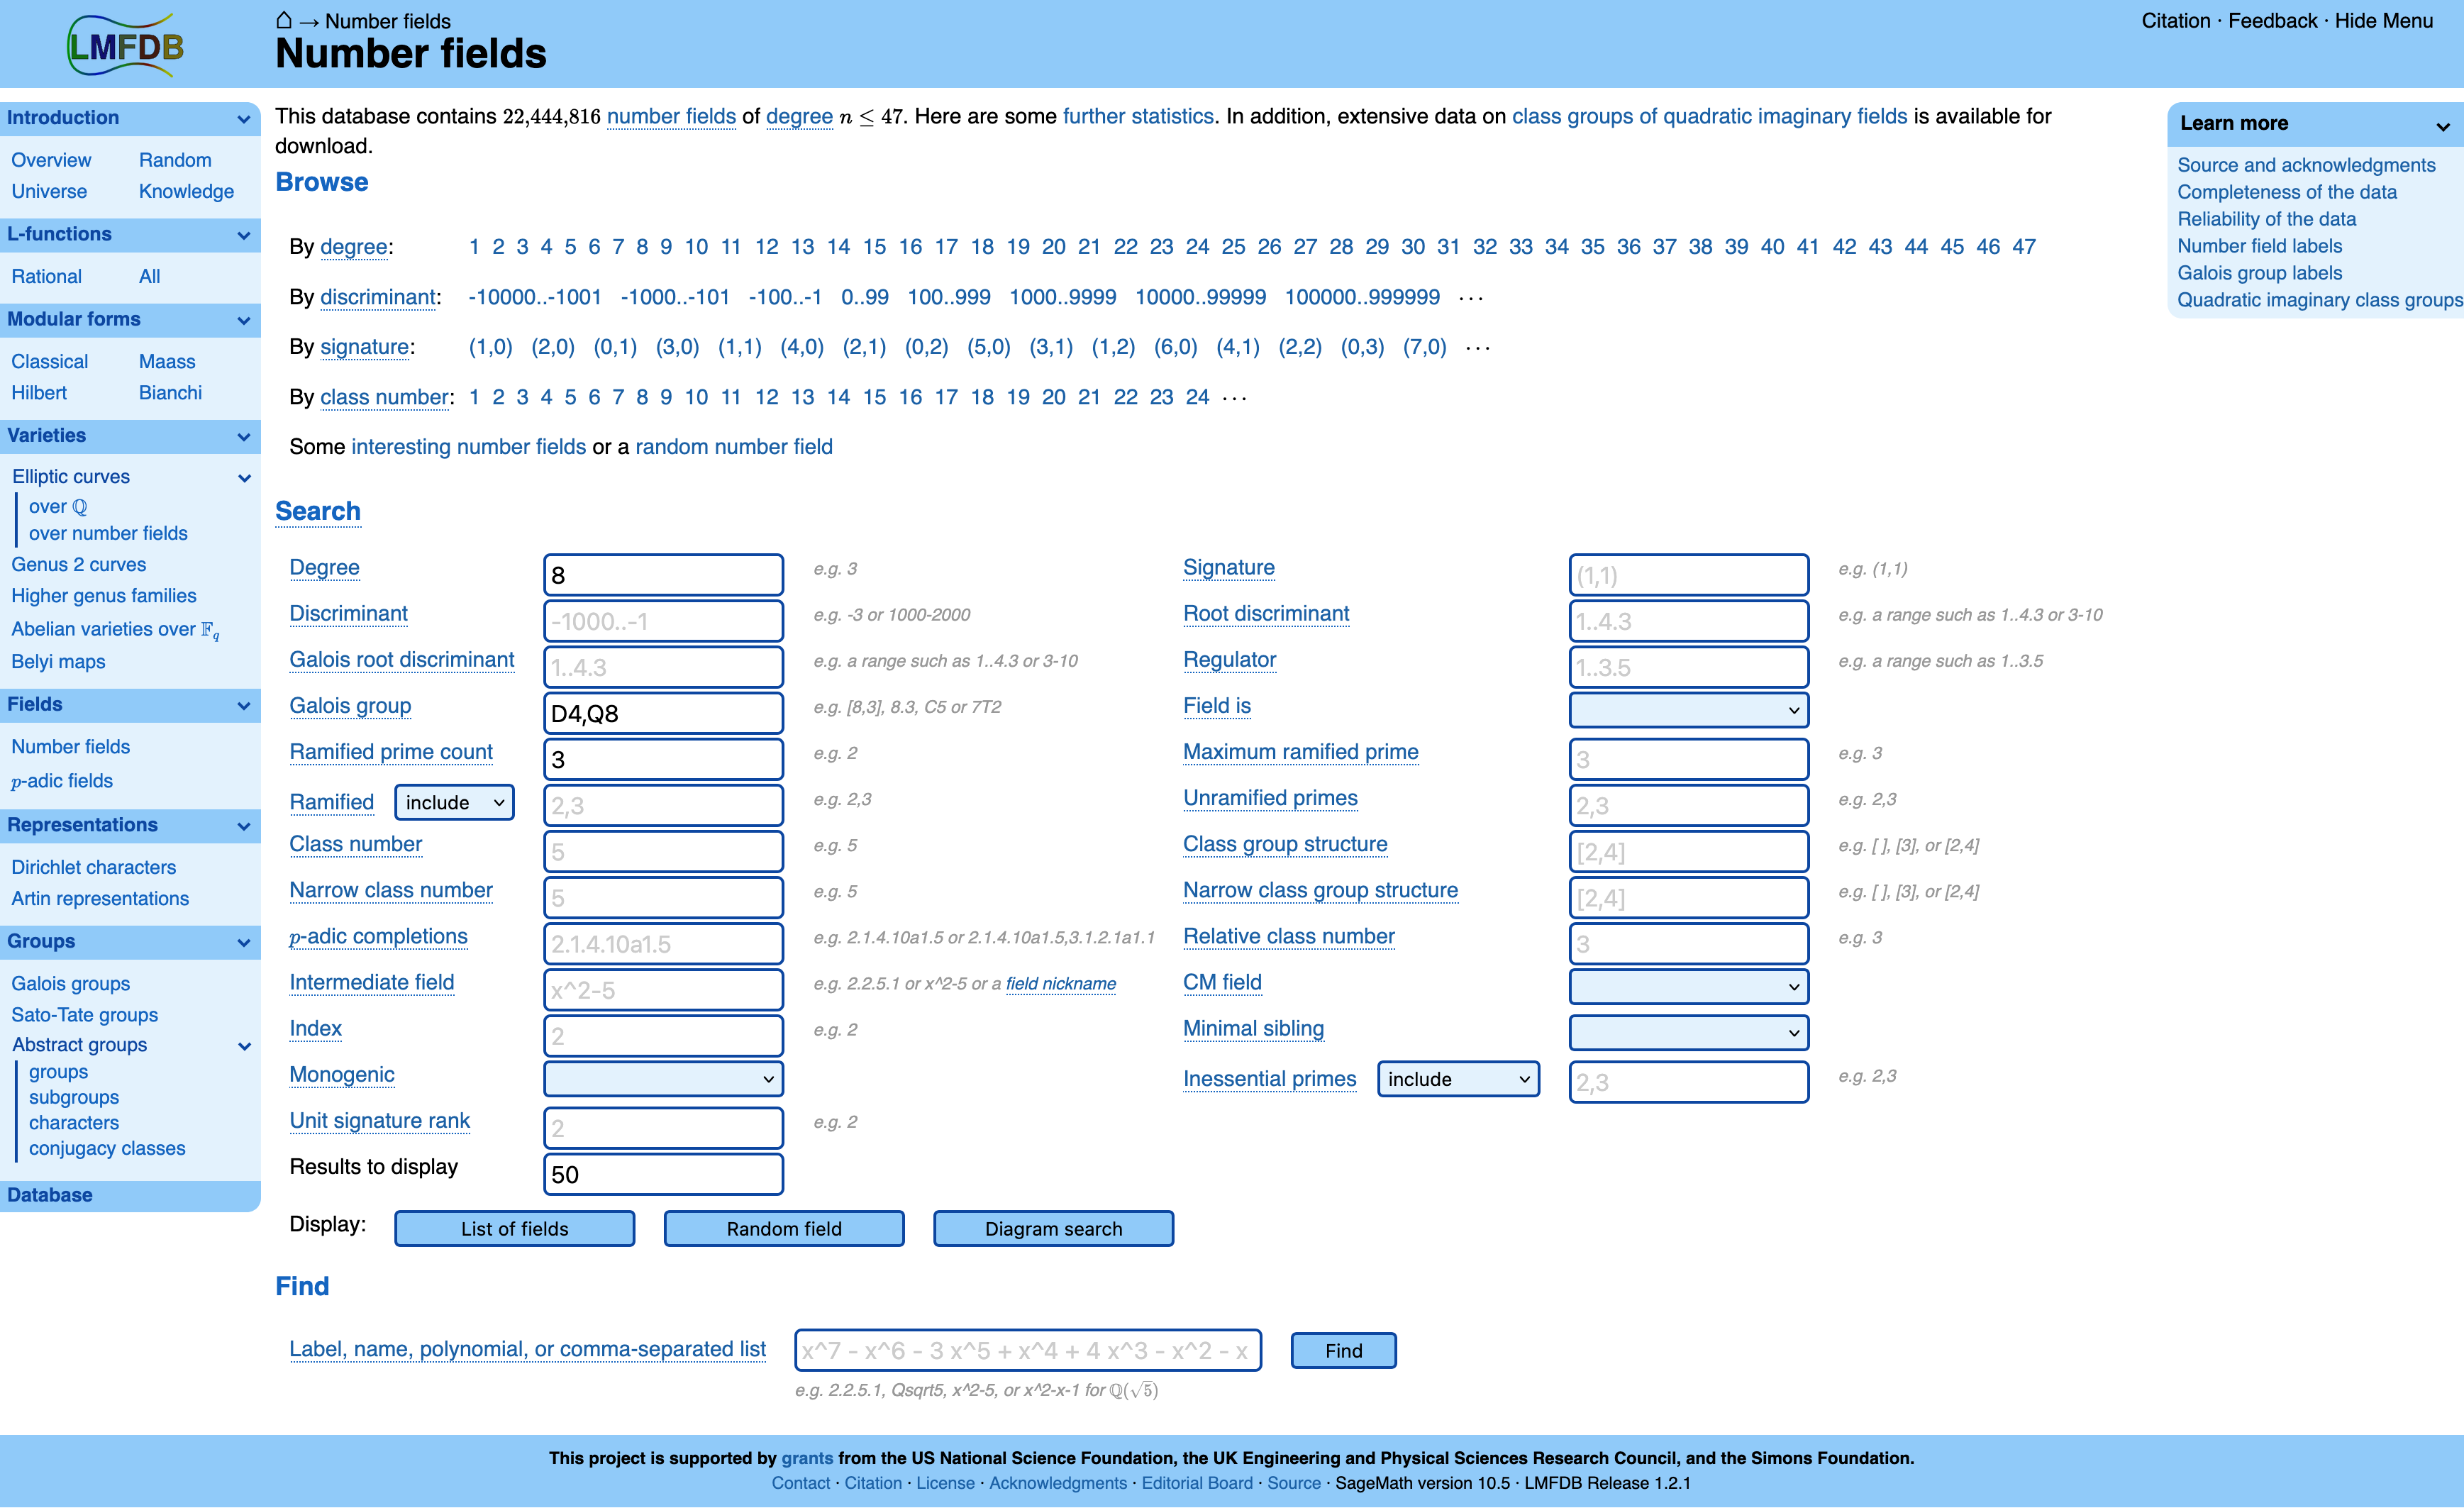
Then click "Display: List of Fields" (you may have to use the beta version of the site if this search takes too long). Then under "Select columns to display", select all and "Determine the number of results" right above the table. Finally, download the displayed columns as a CSV file. The file should be in your downloads folder and be about 3.8MB. This is our first dataset!
You can download the dataset here.
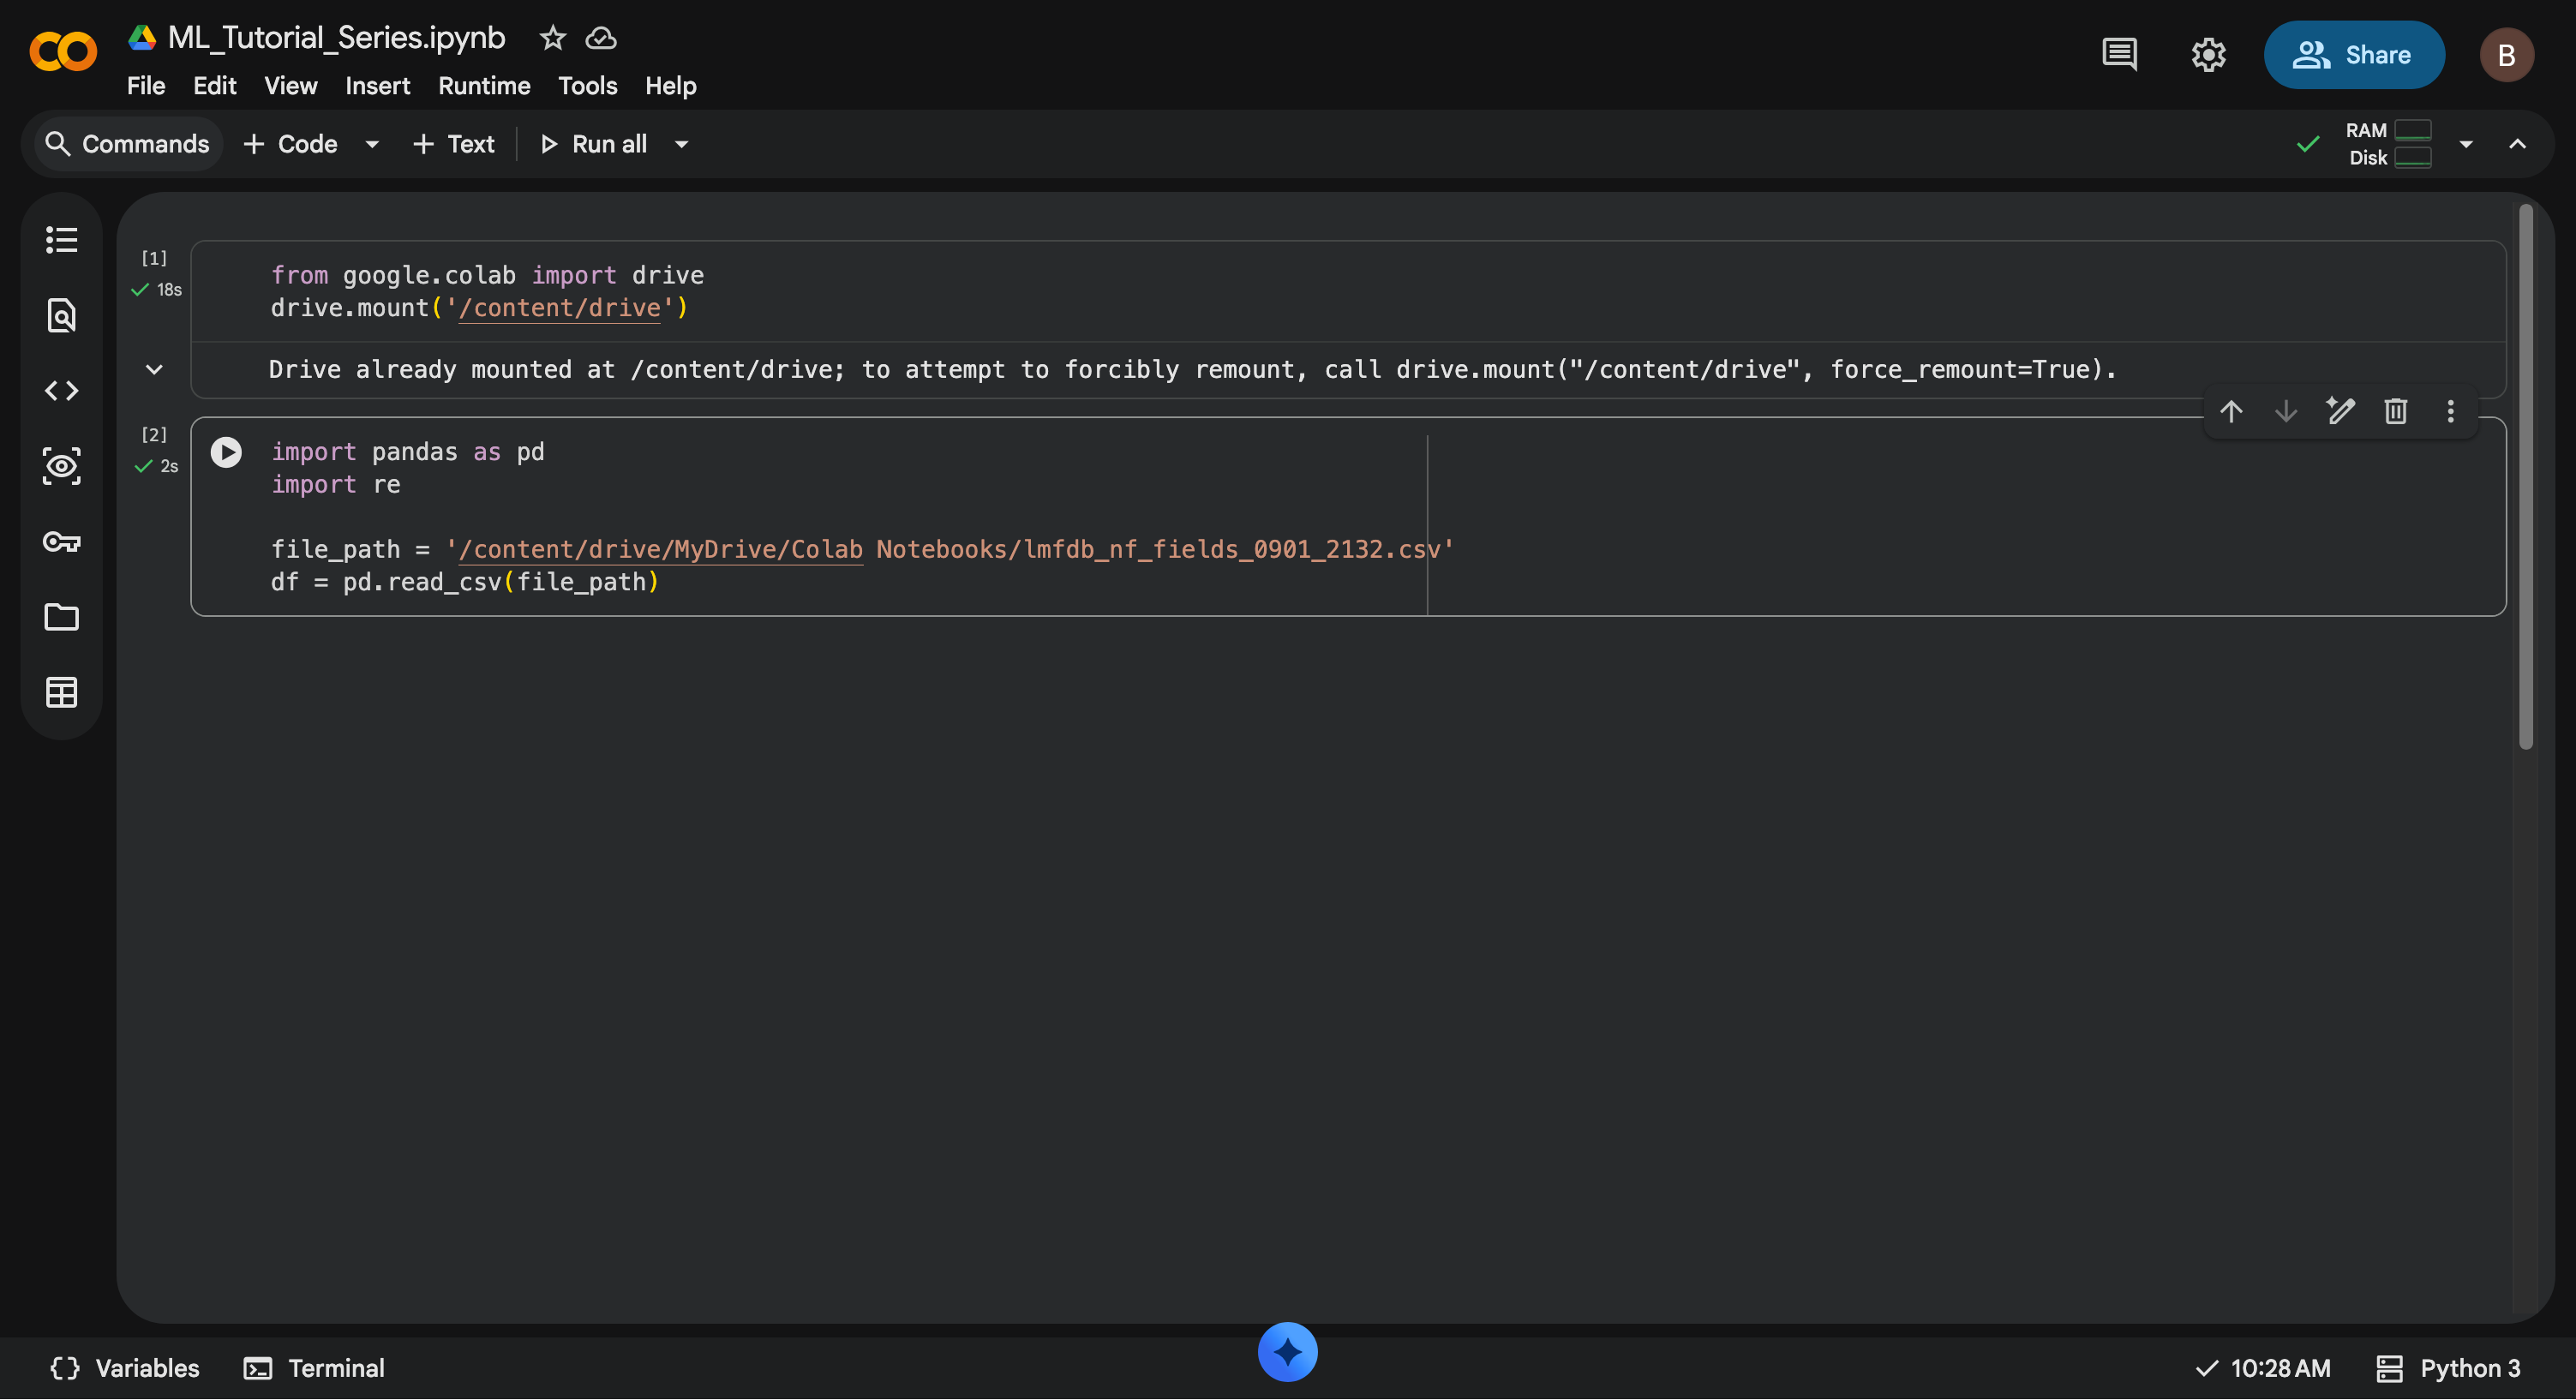
Once you have the data, go ahead and upload it to Google drive in the same folder as your Colab notebook. We can load it into Colab with the following code:
from google.colab import drive
drive.mount('/content/drive')
Next, we are going to load the dataset into a Pandas dataframe with the following code:
import pandas as pd
import re

file_path = '/content/drive/MyDrive/Colab Notebooks/lmfdb_nf_fields_0901_2132.csv'
df = pd.read_csv(file_path)
Now your screen should look something like this:
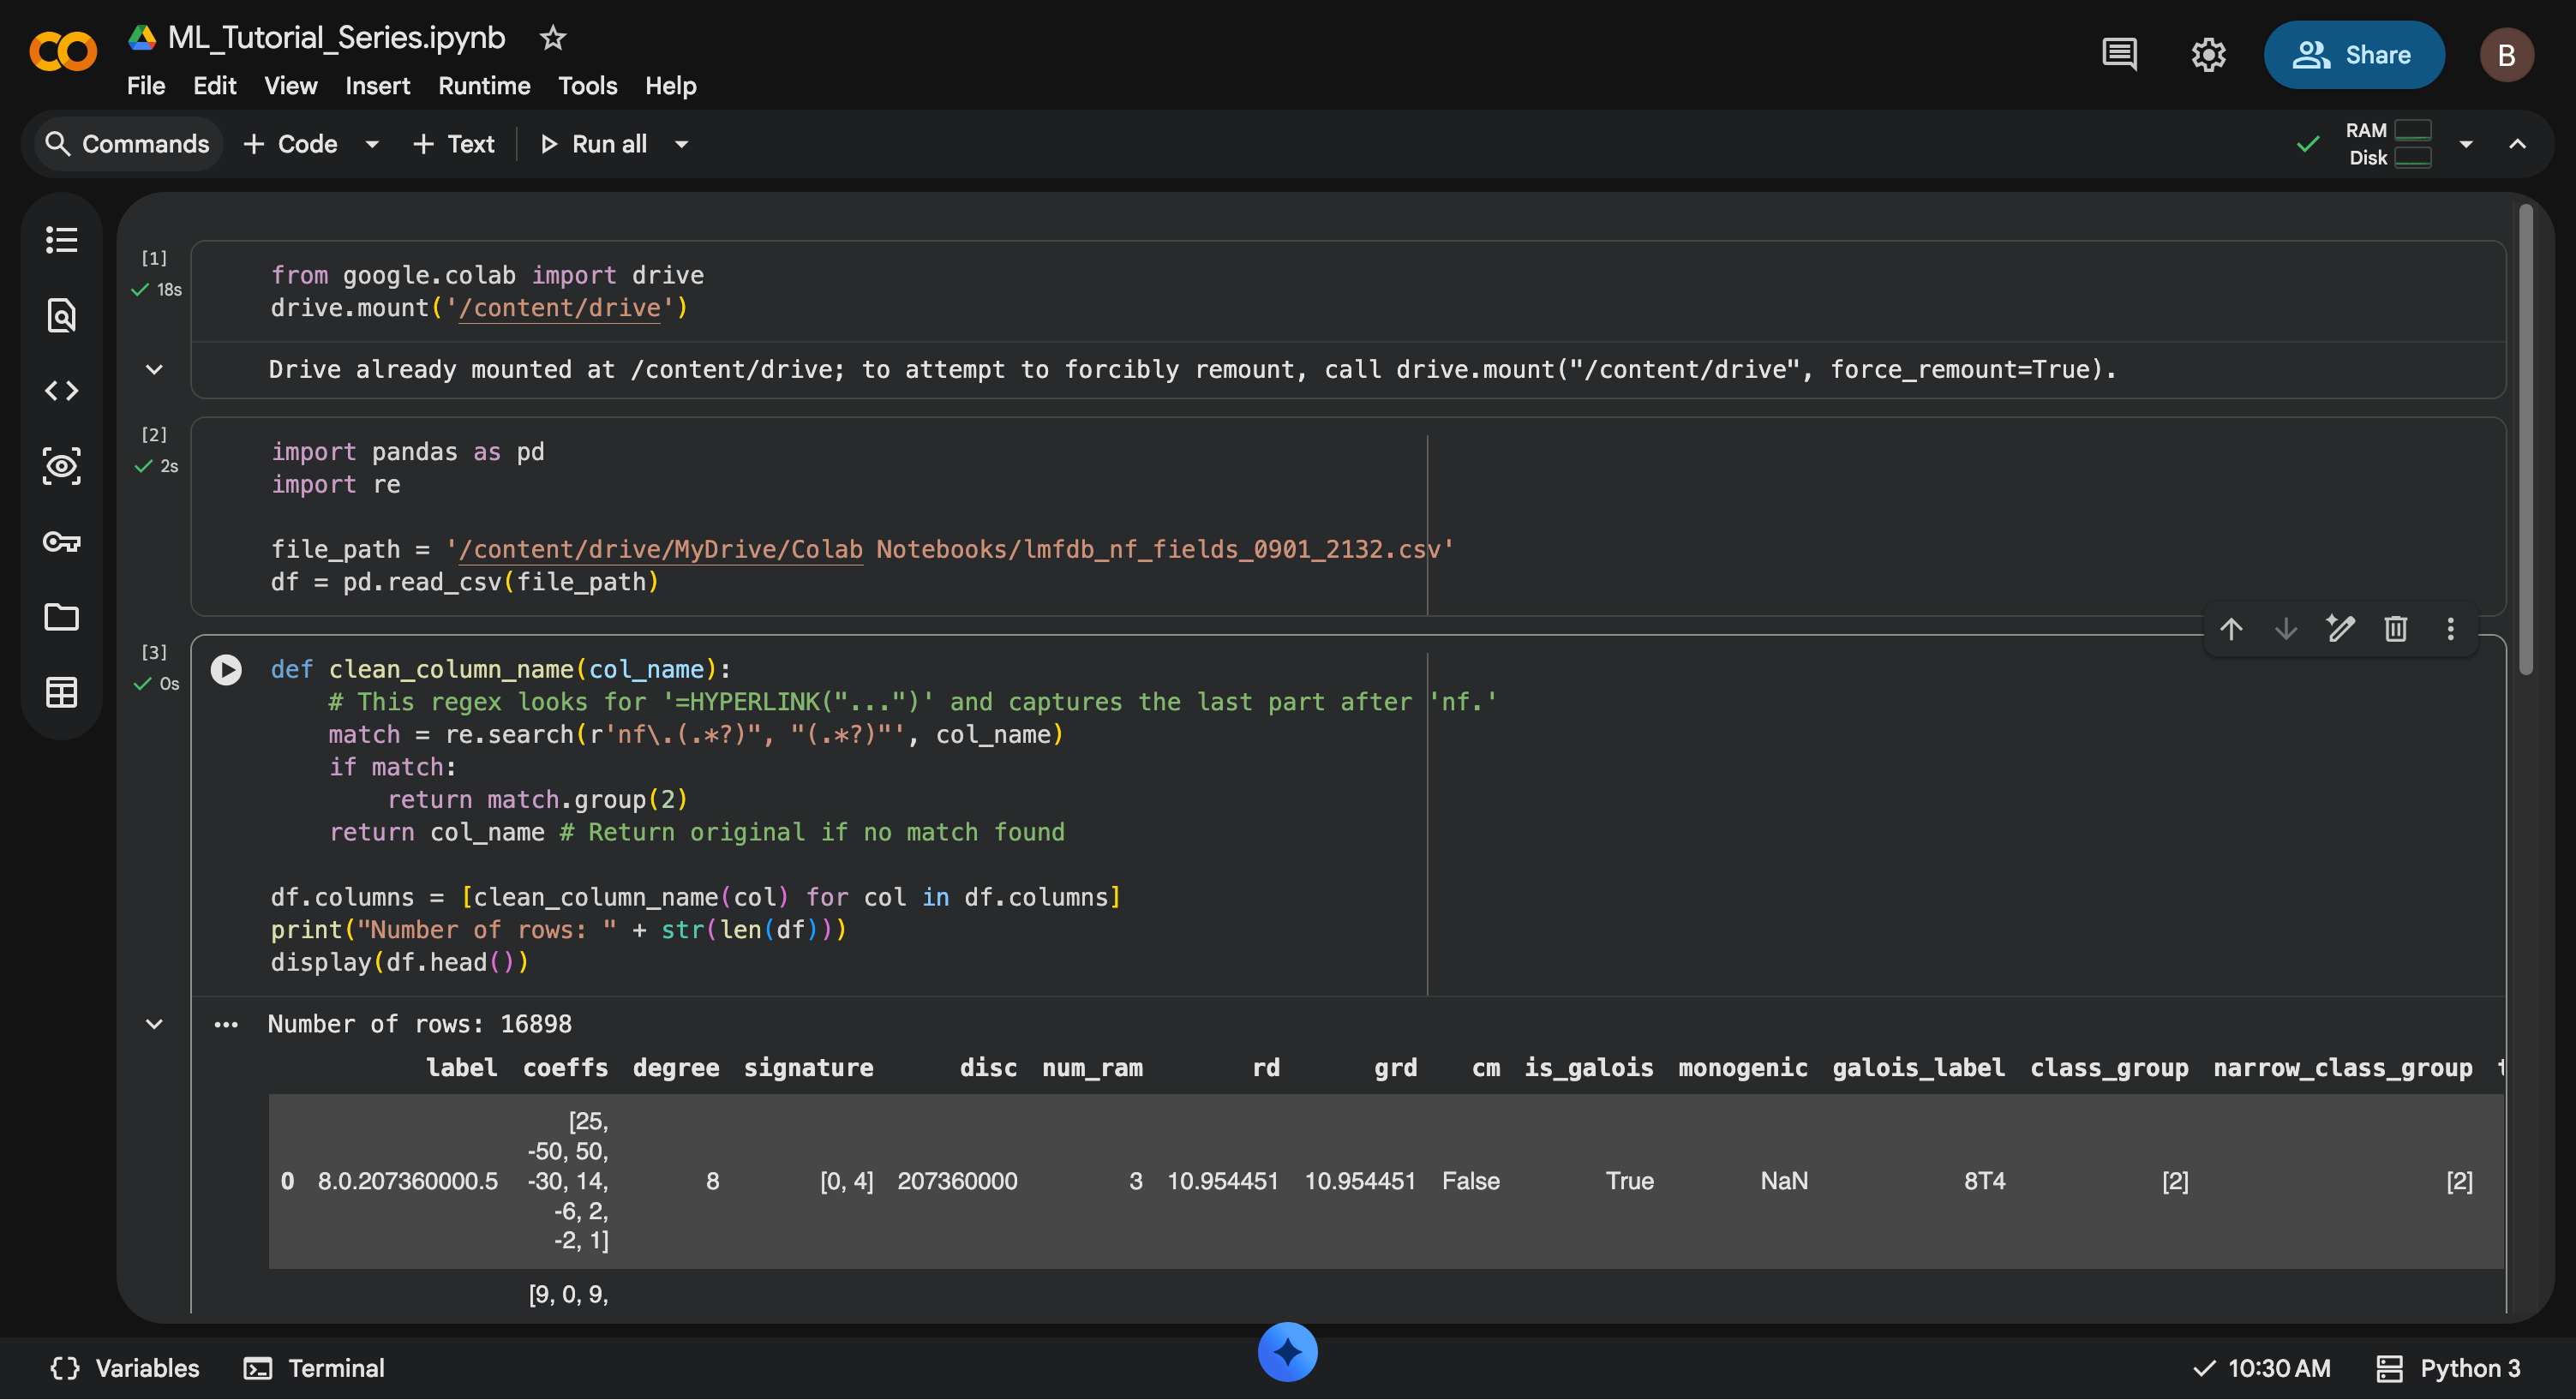
If you were to look at the dataset right now, you would see some slightly strange formatting for the column names. We can clean that up with a little code and take a peek at our dataset:
def clean_column_name(col_name):
    # This regex looks for '=HYPERLINK("...")' and captures the last part after 'nf.'

    match = re.search(r'nf\.(.*?)", "(.*?)"', col_name)
    if match:
        return match.group(2)
    return col_name # Return original if no match found


df.columns = [clean_column_name(col) for col in df.columns]
print("Number of rows: " + str(len(df)))
display(df.head())
You should see something like this:
Congratulations! You have made significant progress towards actually using ML in your math research. If you want to see how this dataset is going to be used, keep going in this tutorial series to Logistic regression and linear probes coming soon.
Generating data
It is also possible to generate your own data if it is not already publicly available. This will be the case 99% of the time. When this is the case, it will be on the researcher to generate a dataset to answer the question they have in mind. Here are some general tips:
- Make sure that you have your data in the form where each row represents one object, with a column for your outcome of interest and column(s) for your dependent variable(s) .
- Have an even distribution for each value of across your dataset. The more evenly distributed your values are across your dataset, the better.
- Generate more data than you think you need, but not so much that things take forever to run.
- This will heavily depend on what you are generating. For example, you will be able to generate many more rows of data if your objects are integers as opposed to your objects being integer matrices.
- Variety is your friend! Instead of having one encoding and one dataset, it is usually a good idea to try multiple encodings and generate multiple datasets.
- Have fun with it, and if something doesn't work, don't be afraid to scrap it and start again. In the age of LLMs being excellent at generating code, there is not much time loss from starting fresh.